See Everything. Miss Nothing.
Live dashboards, drill-down analytics, and role-based views powered by ClickHouse for real-time business intelligence.

Real-Time Business Intelligence
Traditional ERPs give you reports. Tuli gives you answers — in real-time. Our analytics engine, powered by ClickHouse, processes millions of records in milliseconds to deliver live dashboards that reflect the current state of your business.
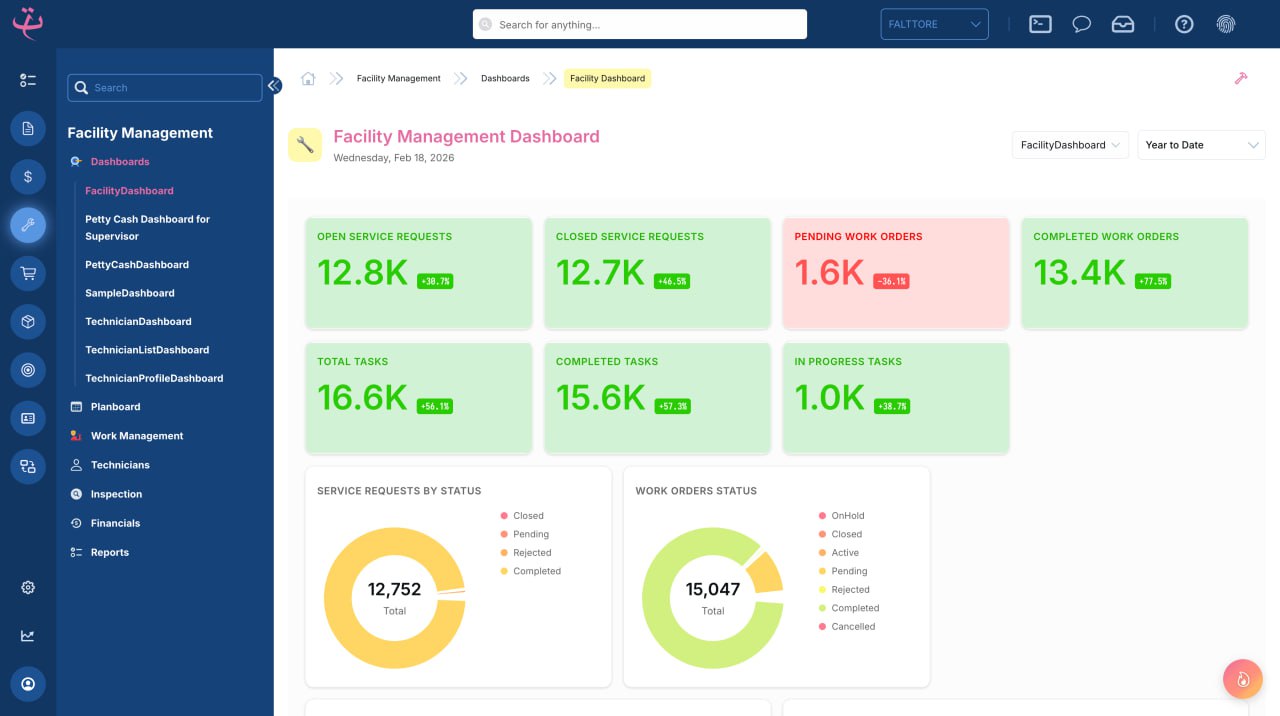
Live Dashboards
Every module comes with pre-built dashboards that update in real-time:
- Scorecards — At-a-glance metrics with trend indicators and targets
- KPI Cards — Key performance indicators with sparklines and period comparisons
- Interactive Charts — Bar, pie, line, and trend charts with click-to-drill-down
- Aging Analysis — Visual aging buckets for receivables, payables, and open items
- Tabular Views — Sortable, filterable data grids with inline calculations
Drill-Down Analytics
Click any number to explore the underlying data. A revenue figure on the executive dashboard drills into revenue by department, then by product, then by individual transaction — all in the same interface.
Role-Based Views
Each role sees the data that matters to them:
- Executives see organization-wide KPIs and strategic metrics
- Department Heads see team performance and departmental analytics
- Operations see real-time workloads, queues, and process metrics
- Finance sees cash flow, budgets vs. actuals, and compliance metrics
ClickHouse Analytics Engine
Tuli uses ClickHouse as its analytics backbone, delivering:
- Sub-second queries across millions of rows
- Real-time aggregations without pre-computation
- Time-series analysis with native support for temporal data
- Concurrent users without performance degradation
Custom Dashboard Builder
Build your own dashboards using the P9 dashboard DSL:
@dashboard LeasePerformance
@application Leasing
@time-period-filter true

scorecard OccupancyRate {
	label: "Occupancy Rate"
	value-key: "Rate"
	query: "SELECT ROUND(AVG(CASE WHEN Status = 'Occupied' THEN 1 ELSE 0 END) * 100, 1) as Rate FROM wh_Leasing_Unit WHERE IsDeleted = false"

	widget-filter {
		"toYear(CreatedAt)" = @year
	}
}

trendline RevenueByMonth {
	label: "Monthly Revenue"
	label-key: "Month"
	value-key: "Total"
	query: "SELECT formatDateTime(CreatedAt, '%b') as Month, SUM(Amount) as Total FROM wh_Leasing_Payment WHERE IsDeleted = false GROUP BY Month ORDER BY toMonth(CreatedAt)"

	widget-filter {
		"toYear(CreatedAt)" = @year
	}

	group-by {
		key: "formatDateTime(CreatedAt, '%b')"
	}
}
The Impact
- 5x faster decision-making with real-time data
- Zero lag between transaction and reporting
- 100% coverage of business processes in analytics
Experience the Platform
See how Tuli brings it all together
Tuli ERP Platform Overview
Ready to Transform Your Business?
See how Tuli ERP can streamline your operations with AI-powered workflows, real-time dashboards, and seamless integration across all your business modules.